 Sometime earlier this summer I got to thinking about Miguel Cabrera, and how sad it was that he—like Albert Pujols—had fallen from his rightful and longtime place as one of baseball’s best hitters. Pujols signed a 10-year contract with the Angels after the 2011 season and had his last 4-win season (using bWAR, Baseball-Reference.com’s WAR) in 2012 at age 32. Cabrera put up a great season at age 33 in 2016 followed by two seasons of mediocrity or injury. The Tigers still owe him $154 million for the next five years.
Although their declines seemed inevitable, I got to wondering if players weren’t aging as well as they had 20 years ago. There didn’t seem to be as many good old players as there used to be. I decided to try to figure it out.
Dan Levitt helped me gather the data I needed, namely all the bWAR in major league history broken down by year and by the age of the player who accumulated it. This was enough to answer my questions.
The following chart shows the percentage of WAR contributed by players of every age between 19 and 43. (Younger and older ages, with comparably minimal values, have been removed for simplification.) As usual, a player’s “age” is his age on June 30 of the year in question.

From 1876 through 2017, 27-year-old players accumulated 8785 WAR, which is 10.19% of the all-time total. This has been the “most valuable” age, but the surrounding years have been comparable – ages 25 to 29 make up nearly half — 48% — of the all-time value. The basic shape of this chart is likely no surprise.
The sum of these age bars will necessarily total 1.0. What I am mainly interested at the moment is the right part of this graph – the older players. Have there been fewer good old players in recent years? For the rest of this paper, I will use the term “old players” to mean “players age 35 or older”. Historically, these “old players” have produced 7.5% of the value in the major leagues.
To simplify things I am going to look at the data since 1968 – 50 years. The next chart shows, for each of these seasons, the percentage of WAR that were accumulated by old players.
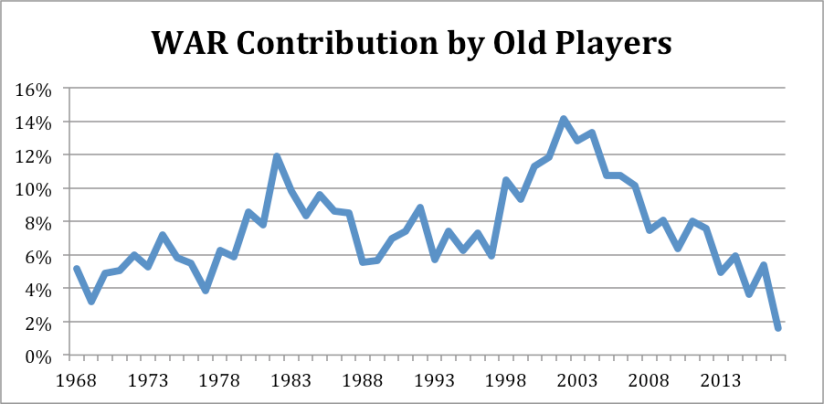
You can see that old player value has been in free fall in recent years. In 2017, age 35+ players accumulated 15.9 WAR in total, just 1.6% of the value in all of baseball. By percentage, this was the smallest total since 1877 when the major leagues were just getting started.
Although most of the annual percentages of WAR by old players falls between roughly 4% and 8%, there are a few exceptions.
There was a brief upsurge of old value in the early 1980s, peaking at 12% of the majors in 1982. Who were these old players? The following table lists all of the age 35+ players who attained 4.0 WAR in 1982:
| 1982 Player | Age | WAR |
| Steve Carlton | 37 | 6.1 |
| Joe Niekro | 37 | 6.1 |
| Al Oliver | 35 | 5.3 |
| Joe Morgan | 38 | 5.1 |
| Jim Palmer | 36 | 4.8 |
| Rod Carew | 36 | 4.7 |
| Tommy John | 39 | 4.2 |
| Hal McRae | 36 | 4.1 |
Although there are a few position players here, this period was notable for its old pitchers; besides those in this table, players like Don Sutton, Phil Niekro, Tom Seaver, and others had fine “old” seasons in surrounding years.
A much larger and more sustained period of old age success came in the 1998-2007 period, with both its arrival and disappearance happening fairly suddenly.
In the 2002 season old players accounted for 14.2% of all big league value, the highest total since World War 2 upended major league rosters. The list of old players who had 4.0 WAR that season:
| 2002 Player | Age | WAR |
| Barry Bonds | 37 | 11.8 |
| Randy Johnson | 38 | 10.5 |
| Curt Schilling | 35 | 8.5 |
| Larry Walker | 35 | 6.1 |
| Jamie Moyer | 39 | 5.6 |
| Kenny Rogers | 37 | 5.0 |
| Greg Maddux | 36 | 4.6 |
| Rafael Palmeiro | 37 | 4.5 |
The decade beginning in 1998 not only had an impressive collection of good old players, it also had a lot of GREAT old players. Here is a count of 7+ win seasons for the last three 10-year periods:
| 1988-1997 | 1 |
| 1998-2007 | 16 |
| 2008-2017 | 1 |
The best season (by this measure) put up by an old player in the 1988-1997 period was by … Ed Whitson in 1990. I am not making this up.
As of today, the last old player to accumulate 7 WAR was Chipper Jones in 2008. It will not happen in 2018.
Here is a list of the 4.0 WAR players in 2017:
| 2017 Player | Age | WAR |
| Nelson Cruz | 36 | 4.1 |
Cruz just squeaked over the the line, and the only other old player over 3.0 was Adrian Beltre at 3.6. It is getting tough out there.
The season is not yet over, but I can say with confidence that the only 2018 qualifier will be Justin Verlander, who sits at 5.0 as of September 11.
Another way to show this obvious trend is to look at the average annual age, weighted by WAR. Every player’s WAR value is multiplied by his age, and then divided by the total WAR in the big leagues that season. Again using the past 50 seasons:
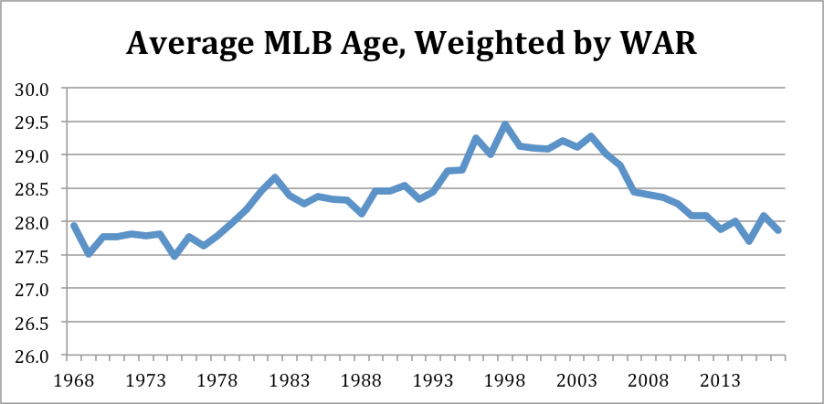
The average age, weighted by WAR, has recently been at its lowest level in 40 years.
Setting aside the reasons for the exceptional aging that went on between 1998 and 2007, which has been debated to death, it is interesting to wonder why players are not aging as well today. The most common answer will be “steroids testing,” but could there be other causes?
Could the current game, which values velocity in pitchers and the ability to hit velocity in batters, be more of a “young man’s game”? Could pitching velocity be causing more injuries and therefore shorter careers? Could an historical crop of young stars – Mike Trout, Mookie Betts, Francisco Lindor, Carlos Correa and many more – be temporarily skewing the data?
All of this and more could be true.
How should this effect how the game is managed? In the past 40 years, many or most of the “bad free agent contracts” have come about because teams have signed 30-year-old players and expected them to keep playing the way they played over the previous five seasons. The historically great aging that took place in the 1998-2007 period might have convinced teams that things had changed, that they could finally sign 30-year-olds with confidence. Oops.
The baseball salary system favors older (read: declining) players. Generally speaking, if a player reaches free agency after his Age 29 season, around 70% of his career is likely to be behind him. His first team likely got his entire prime (ages 25-29) at relatively low cost, and the team that signs him will get his expensive, declining seasons.
In the recent off-season there was some controversy because several free agents did not get offers well into the winter. The players claimed collusion, which is certainly possible. But it also could be a (belated) collective understanding of how players are aging. The “solution” to this problem, for the players, is a salary system that rewards players in their 20s instead of in their 30s.

Interesting article. I think there may be an opportunity for baseball to take a page from tennis in terms of aging trends. Consider that in 1990, only 6% of tennis players were over 30 (talk about a young man’s game!). By 2017, this swelled to over 40%. The same age trends; however, are not happening at the lower levels (i.e. top 1,000) levels. The reason is hyper-professionalization at the very top of the sport that is available to players with the money to hire trainers, nutrition experts and on and on. Novak Djokavic sleeps in hypobaric chambers for heaven’s sake. While teams have hired similar professionals, it’s nowhere close to the level tennis players have taken things – and the players don’t have the same incentive with many baseball players in the favorable part of the contract curve vs. the eat what you kill economic structure in tennis.
Interesting article on this here https://medium.com/@mathzero/why-are-tennis-players-getting-older-eb2fb5895929
LikeLike
Very nice. I was thinking recently about the Red Sox picking up Tom Seaver in ’86, the Jays getting Juan Beniquez in ’87, the Tigers Doyle Alexander in ’87. Old players acquired at the deadline. There’s something you haven’t heard in a while. I’m not sure how they rank, but the ’88 Tigers averaged 32 years of age. I doubt very many teams recently have topped that. Maybe the late 90’s Orioles. Anyway, my few thoughts. It would be unheard of today.
LikeLike
A guess: As performance inches ever closer to the theoretical peak the mechanics of a human allow for, there is ever less margin for error. A tiny flaw in the delivery of a guy throwing 100 mph might blow his arm out, where if he were lobbing the ball in at a mere 90 mph there would be more opportunity to correct the flaw before the results were catastrophic. Bulk the muscles up and you end up with a tendon tear. So, in this hypothesis, fewer guys survive intact to play into ripe old age, and many of the guys who manage this are playing with manifold minor injuries that reduce their productivity.
And I suspect you are on to something with the idea that an old man of 35 may not have the reaction time to hit a 100 mph pitch, where he could if it were 90 mph.
It would be interesting to compare with elite athletes competing against a clock or other objective criterion. How well to elite runners or weight lifters age, compared with their predecessors? I have no idea.
LikeLike
Nice! Mark, how much of the decline is that the players are getting worse, and how much is that there are fewer of them (or they’re getting less playing time)?
LikeLike
The data can not tell us that, of course. My own theory is that it is a combination of the game getting more difficult for older players (need to throw 98 or hit 98), and players are not aging as well. Part of this is that the young players are better. In general, I would not want to bet on players getting worse as a reason.
But nothing I have done would really answer that — its just theory.
LikeLike
Hmmm … is it easy to do another graph to show WAR/PA for each year? Or even just total PA?
LikeLike
Great article, Mark. I think I did something on this back in 2006, so I did not see the big decline that you show. Very interesting
LikeLike
Thanks, Cy.
LikeLike
+1 to Phil’s comment. Seems like the data here is skewed by the # of players at each age. You could normalize by using WAR/500 PAs or something similar vs. straight WAR.
LikeLike
I think the reasonable approach would be to have a uniform annual base salary, say $60,000, with the remainder being incentive-based, final salary to be determined after the season by performance during the season.
LikeLike
1998-2007 also had a high use of steroids and growth hormones.
LikeLike
Nice analysis! I think the biggest reason for the drop is the outlawing of the use of amphetamine, which allowed the older guys to keep up their performance level all game long and season long. I would guess that the rise in the period before was due to baseball players and teams using better healthcare and being able to stay in playing shape all year round, instead of having to work in insurance or whatever in the off season.
LikeLike